Mapping CH4 in urban areas is still challenging because emissions are often diffuse. A new study https://doi.org/10.1016/j.atmosenv.2024.120743 finds evidence of urban superemitters that can substantially incrase emissions.
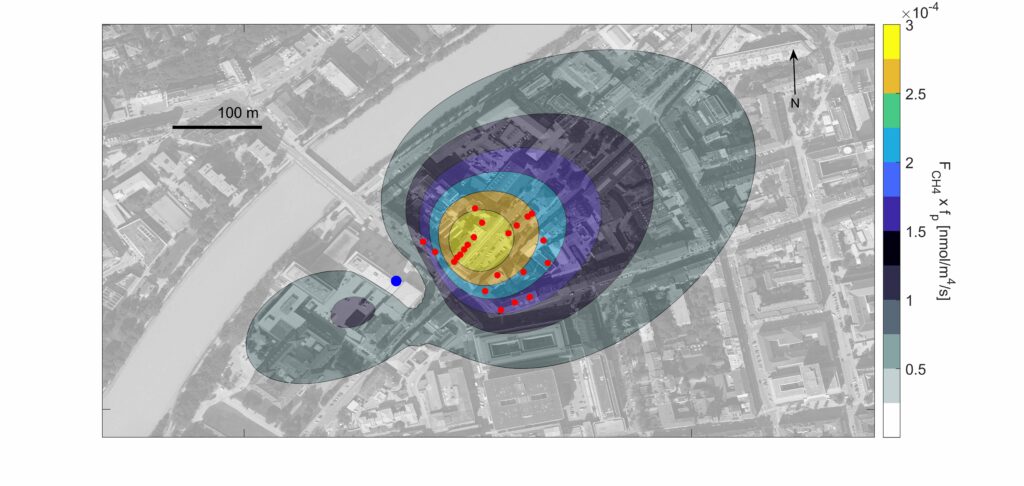
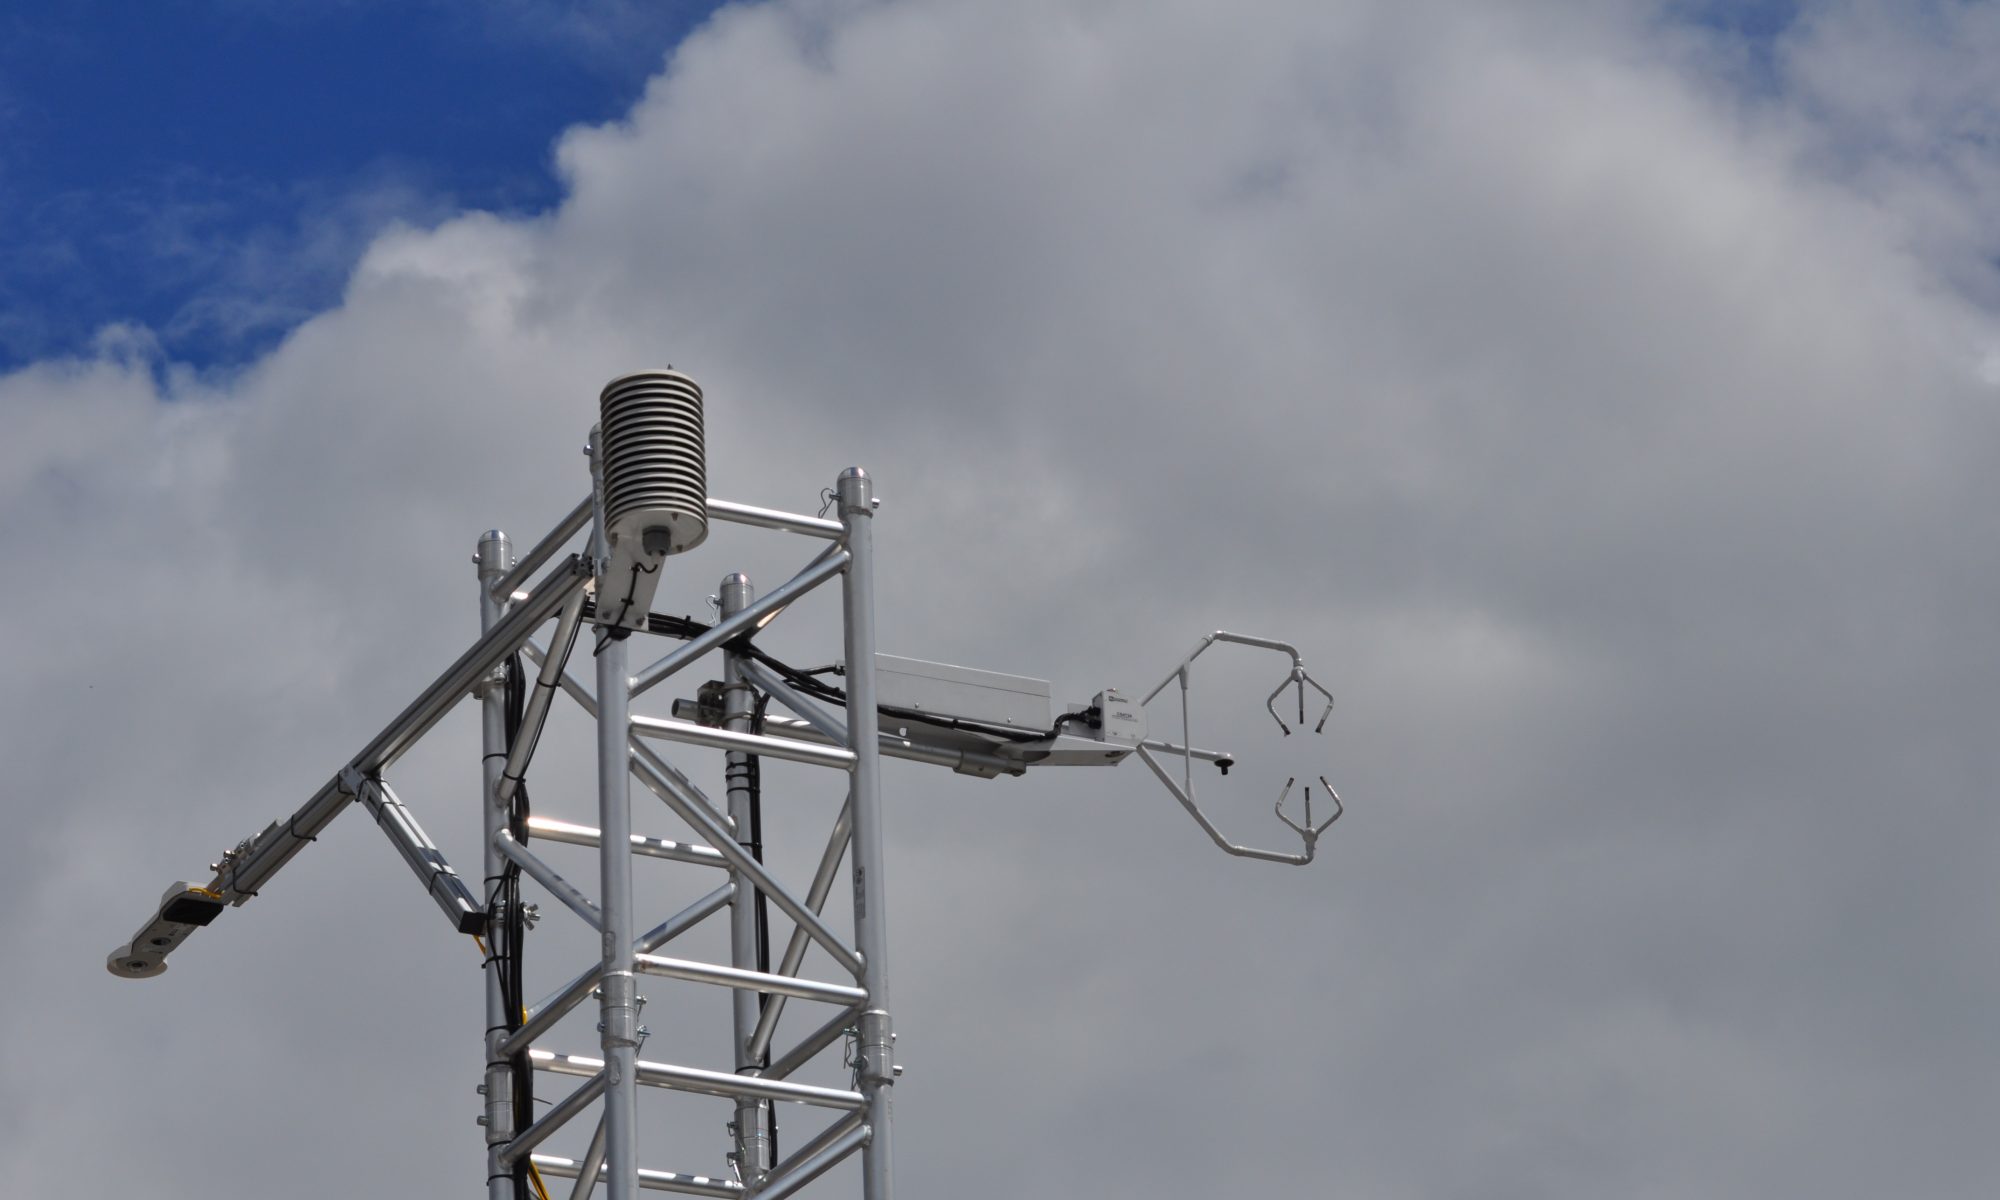
Methane fluxes increased significantly with decreasing temperature and showed a negligible weekend to weekday effect. CH4 emissions were dominated by natural gas consumption in the residential, commercial and public sectors in Innsbruck. The average methane to CO2 flux was 0.2%. For the building sector this translates to a 100 y GWP adjusted value of 12% relative to CO2, Likely emission sources of methane are building vents and chimneys at roof top levels. Generally, post-metre emissions from gas furnaces consist of time-varying and constant factors. These include leaking valves and fittings, and incomplete combustion of natural gas appliances during ignition or usage. The study shows that time-varying fluxes due to malfunctioning devices and/or leaks can persist for months, increasing area weighted fluxes by up to a factor of 2. Eddy covariance observations above the urban canopy are uniquely suited to constrain the total methane flux, because measurements at street level could miss a large fraction of the post-meter emissions from building vents and chimneys in an urban area. Assessments of street level observations therefore likely yield a lower limit of urban methane emissions.